laboratory instruments distributor
Infrared spectrometer >> FTIR
Infrared February
Infrared spectroscopy
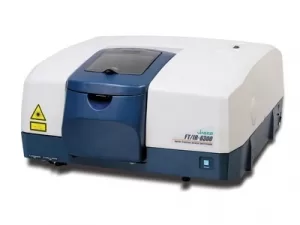
Infrared spectrometer (February infrared spectroscopy) is an FTIR spectroscopy that deals with the infrared region of the electromagnetic spectrum, that is, light with a longer wavelength and a lower frequency than visible light. It includes a range of techniques that are mainly based on absorption spectroscopy. Like all spectroscopic methods, it can be used to identify and study chemicals. One of the common laboratory equipments that uses this technique is the Fourier transform infrared spectrometer (FTIR).
Fourier Transform Infrared Spectrometer Components (FTIR)
A typical FTIR spectrometer includes a source, an interferometer, a sample chamber, a detector, an amplifier, an A / D converter, and a computer. Creates a radiation source that passes the sample through the interferometer and reaches the detector.
The signal is then converted to digital signal by the amplifier and the analog-to-digital converter, respectively. Finally, the signal is transmitted to a computer where the Fourier transform is performed. The following is a block diagram of an FTIR spectrometer. The main difference between the FTIR spectrometer and the IR spectroscopy is the Michelson interferometer scatter.
The infrared part of the electromagnetic spectrum is usually divided into three regions. Near, middle, and far infrared, named because of their association with the visible spectrum. Higher energies close to IR, approximately 14000-4000 cm -1 (wavelength 0.8-2.5 μm) can trigger color or harmonic vibrations.
The average infrared, approximately 4000-400 cm- 1 (2.5-25 μm) may be used to study the underlying vibrations and the associated rotational vibration structure. The far infrared, approximately 10–400 cm- 1 (25–1000 μm), adjacent to the microwave area, has low energy and may be used for rotational spectroscopy.
The names and classifications of these subregions are conventional and are based solely on relative molecular or electromagnetic properties.
Infrared spectroscopy theory
Infrared spectroscopy uses the fact that molecules absorb certain frequencies that characterize their structure. These absorptions are resonant frequencies, meaning that the frequency of the absorbed radiation corresponds to the frequency of the bond or vibrational group. Energies are determined by the shape of the molecular potential energy levels, the mass of the atoms, and the associated vibrational bonds.
In particular, in the created Oppenheimer and harmonic approximations, that is, when the molecular Hamiltonian corresponding to the electronic ground state can be approximated by a harmonic oscillator in the vicinity of the molecular geometry, the resonance frequencies with the natural surface-related states Molecular electronics potential energy levels.
However, resonant frequencies can be the first approach to the bond strength and mass of atoms at both ends. Therefore, the frequency of vibrations can be related to a particular type of bond.
For a vibrational state to be “active” in an IR molecule, it must be accompanied by permanent bipolar changes.
A molecule can vibrate in different ways, and each path is called a vibrational state. Linear molecules have a 3N – 5 degree vibrational state while nonlinear molecules have a 3N – 6 degree vibrational state (also called the degree of freedom vibration). For example H 2 6 = 3 degrees of vibrational freedom, or the state – O, a nonlinear molecule, 3 × 3.
Simple two-atom molecules have only one bond and only one vibrating band. If the molecule is symmetric, for example N 2 , the group is not observed in the infrared spectrum, but only in the Raman spectrum. Asymmetric diatomic molecules, such as CO, are absorbed in the IR spectrum. Complex molecules have many bonds and their vibrational spectra are more complex, meaning that large molecules have many peaks in their IR spectrum.
Atoms in a CH 2 group, usually present in organic compounds, can vibrate in six different ways: symmetrical and antisymmetric stretching, shearing, warping, shaking and twisting.
How does an infrared spectrometer work?
Step 1 : The first step is sample preparation. The standard method for preparing a solid sample for an FTIR spectrometer is to use KBr. About 2 mg of the sample and 200 mg of KBr are dried and ground. The particle size should be the same and less than two micrometers.
The mixture is then compressed to form clear pellets that can be measured directly. For liquids with a high boiling point or viscous solution, it can be added between two NaCl pellets. The sample is then fixed and tilted in the cell. The volatile liquid, for example, dissolves in CS 2 or CCl 4.
To form a solution 10 then the solution is injected into the liquid cell for measurement. The gas sample should be measured in a gas cell with two KBr windows on each side. The gas cell must first be vacuumed. The sample can then be introduced to the gas cell for measurement.
Step 2: The second step is to obtain the background spectrum by collecting the interference and then converting it to frequency data by inverse Fourier transform.
We obtain the background spectrum because the solvent in which we place our sample contains traces of soluble gases as well as solvent molecules that share information that is not our sample.
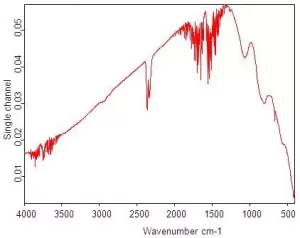
The background spectrum contains information about species of gases and solvent molecules, which may then be removed from our sample spectrum to obtain sample information. The following figure shows an example of an FTIR background spectrum.
The background spectrum also takes into account several other factors related to the performance of the device, including source information, interferometer, detector, and ambient water share (note the two groups of irregular lines, about 3600 cm -1 and about 1600 cm ) . Cm -1 in the figure below) and carbon dioxide (double in 2360 cm -1 and sharp spike in 667 cm -1 in the figure. 6
“>6 6
) are available on the light bench.
Step 3: In the next step , we will collect a single beam spectrum of the sample that will contain the absorbing bands of the sample as well as the background (gaseous or solvent).
Step 4: The ratio between the single-beam sample spectrum and the single-beam background spectrum gives the sample spectrum (Figure below)

InAsSb photovoltaic detectors
Unfortunately, many detectors in the MIR space rely on hazardous materials specified by RoHS standards. These materials are also prone to high variance in high volume.
The chemist is proud to present a fully RoHS compliant product line based on indium arsenide antimonide (InAsSb). Mercury, cadmium or lead are not used.
Unlike cadmium-mercury telluride (MCT) detectors, InAsSb detectors are RoHS compliant. They also have very stable properties and minimal changes from one detector to another. The cut-off wavelength of our InAsSb detectors varies from 3 μm to 14 μm.
Consider these features when choosing an InAsSb detector:
- allergy
- Special detection capability (D *)
- Noise
- Linearity
- Speed
Quantum Cascade Lasers (QCL)
QCLs have a very narrow diffusion band in the mid-infrared region, which makes them suitable for high-precision measurements. When choosing QCLs, consider these features:
- Peak release
- tuning
- Output power
- Operating temperature
- Operational flow
- Packaging (TO can / HHL / butterfly)
We offer continuous wave (CW HHL package) and pulsed QCLs with emission wavelengths in the range of 4-10 μm. They have high output, high response speed and high reliability.
Customization includes:
- Wavelength range or maximum propagation
- Output power
- Working temperature and flow
- Additional cooling steps
Daneshvar Shimi Company is an importer of laboratory equipment, laboratory and research equipment and chemicals. Daneshvar Shimi Company also has the ability to supply spare parts for laboratory equipment and laboratory devices purchased by centers that have problems.
Source: https://www.ru.nl/systemschemistry/equipment/optical-spectroscopy/infrared/
https://www.hamamatsu.com/eu/en/applications/infrared-spectroscopy.html
Products related to water and sewage laboratory >>
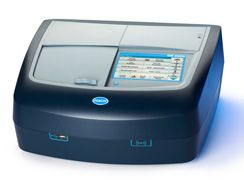
Specialized water spectrophotometer
Application: Water and Wastewater Laboratory
The spectrophotometer is used to measure 60 parameters in water and wastewater.

Water photometer
Application: Water and Wastewater Laboratory
Water photometers are used to measure 50 different parameters in water and wastewater.
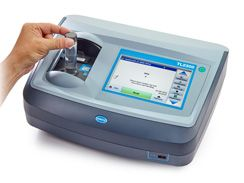
Water and wastewater turbidity meter
Application: Water and Wastewater Laboratory
Turbidimeter is used to measure the turbidity of water and sewage.
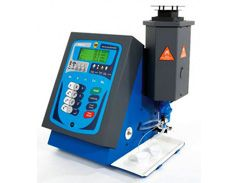
Film photometer
Application: Water and Wastewater Laboratory
Film photometer for measuring calcium, sodium, potassium, lithium and barium

PH meter of water and sewage
Application: Water and Wastewater Laboratory
PH meter is used to measure acid and alkali numbers.
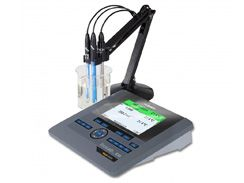
EC meter and salinity meter
Application: Water and Wastewater Laboratory
The EC meter is used to measure the electrical conductivity and salinity of water.

Oxygen meter for water and sewage
Application: Water and Wastewater Laboratory
An oxygen meter is used to measure water-soluble oxygen.
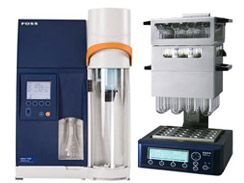
Nitrogen determination
Application: Water and Wastewater Laboratory
The caldera device is used to determine nitrogen in water and wastewater.

BOD meter
Application: Water and Wastewater Laboratory
The BOD device is used to measure the BOD or biochemical oxygen demand of water.
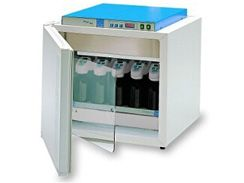
BOD incubator
Application: Water and Wastewater Laboratory
The BOD incubator is used to supply and place the BOD temperature meter.
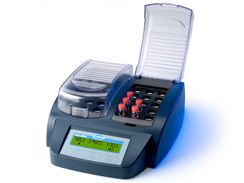
COD Meter - COD Reactor
Application: Water and Wastewater Laboratory
The COD device is used to measure the COD or chemical oxygen demand of water.

Gartst
Application: Water and Wastewater Laboratory
Gartest is used to determine the appropriate amount of the main coagulant water.
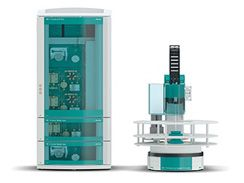
ION Chromatograph
Application: Water and Wastewater Laboratory
An ion chromatograph is used to measure anions and cations.

BOD incubator
Application: Water and Wastewater Laboratory
The HPLC device is used for separation and purification in water and wastewater.
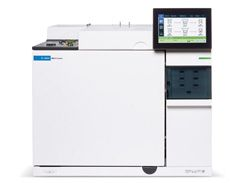
GC chromatograph
Application: Water and Wastewater Laboratory
The GC device is used to examine and isolate volatiles without decomposing them.
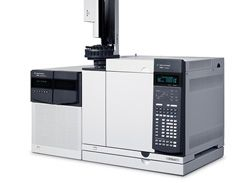
GCMS mass chromatograph
Application: Water and Wastewater Laboratory
The GC-MS device is used to identify different materials in a sample.

Accurate laboratory scales
Application: Water and Wastewater Laboratory
Laboratory scales are used to weigh samples in the laboratory.
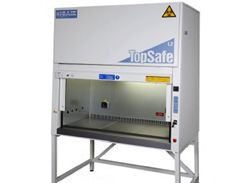
Microbial hood
Application: Water and Wastewater Laboratory
The microbial hood is used to prevent the transmission of microbial and viral infections.

Chemical hood
Application: Water and Wastewater Laboratory
Chemical hood is used to prevent the development of acidic and chemical vapors.

Laboratory chemicals
Application: Water and Wastewater Laboratory
Merck, Sigma, Charlotte chemicals and HACH reagents for water and wastewater laboratory
Email : info@d-chemi.com
site : www.d-chemi.com

